Page 16 - Kindergarten.indd
P. 16

Name __________________________________________________________________


                                               Core Skills 3


              2.MD.9: Generate measurement data by measuring lengths of several objects to the nearest
              whole unit, or by making repeated measurements of the same object. Show the measurements
              by making a line plot, where the horizontal scale is marked off in whole-number units.


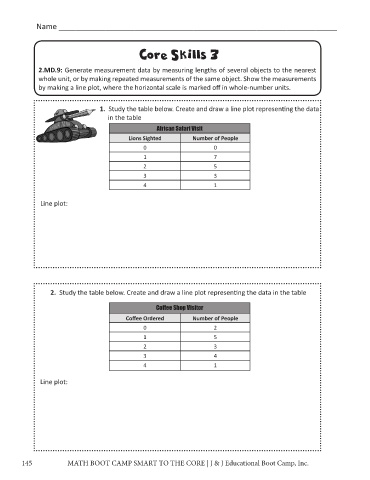
                                  1. Study the table below. Create and draw a line plot representing the data
                                     in the table

                                                     African Safari Visit
                                            Lions Sighted        Number of People
                                                0                       0
                                                1                       7
                                                2                       5
                                                3                       3
                                                4                       1


              Line plot:


                  2. Study the table below. Create and draw a line plot representing the data in the table

                                                     Coffee Shop Visitor

                                           Coffee Ordered        Number of People
                                                0                       2
                                                1                       5
                                                2                       3
                                                3                       4
                                                4                       1


              Line plot:


        145            MATH BOOT CAMP SMART TO THE CORE | J & J Educational Boot Camp, Inc.
   11   12   13   14   15   16   17   18   19   20