
Page 12 - Kindergarten.indd
P. 12
Name __________________________________________________________________
Core Skills 1
2.MD.9: Generate measurement data by measuring lengths of several objects to the nearest
whole unit, or by making repeated measurements of the same object. Show the measurements
by making a line plot, where the horizontal scale is marked off in whole-number units.
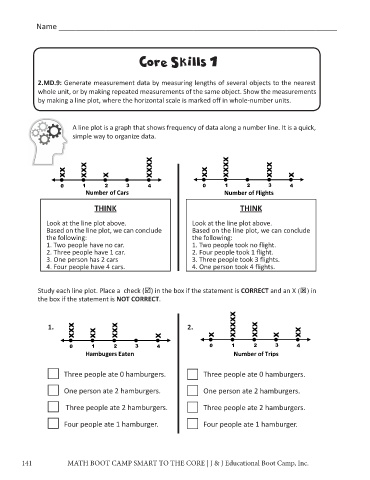
A line plot is a graph that shows frequency of data along a number line. It is a quick,
simple way to organize data.
XX XXX X XXXX XX XXXX XXX X
0 1 2 3 4 0 1 2 3 4
` Number of Cars Number of Flights
`
THINK THINK
Look at the line plot above. Look at the line plot above.
Based on the line plot, we can conclude Based on the line plot, we can conclude
the following: the following:
1. Two people have no car. 1. Two people took no flight.
2. Three people have 1 car. 2. Four people took 1 flight.
3. One person has 2 cars 3. Three people took 3 flights.
4. Four people have 4 cars. 4. One person took 4 flights.
Study each line plot. Place a check () in the box if the statement is CORRECT and an X () in
the box if the statement is NOT CORRECT.
XXXXX
XXX XX XXX X X XXX X XX
1. 2.
0 1 2 3 4 0 1 2 3 4
Hambugers Eaten ` Number of Trips
`
Three people ate 0 hamburgers. Three people ate 0 hamburgers.
One person ate 2 hamburgers. One person ate 2 hamburgers.
Three people ate 2 hamburgers. Three people ate 2 hamburgers.
Four people ate 1 hamburger. Four people ate 1 hamburger.
141 MATH BOOT CAMP SMART TO THE CORE | J & J Educational Boot Camp, Inc.